 By
By Plotting in Python
We're making the same plot in a range of Python plotting libraries.
Each library has a different strength - click the buttons below to learn more!
How to make plots using Pygal
This is a series of introductions to Python plotting libraries. This time we’re talking about Pygal.
Pygal is the library for people who like things to look good. It puts style first, literally.
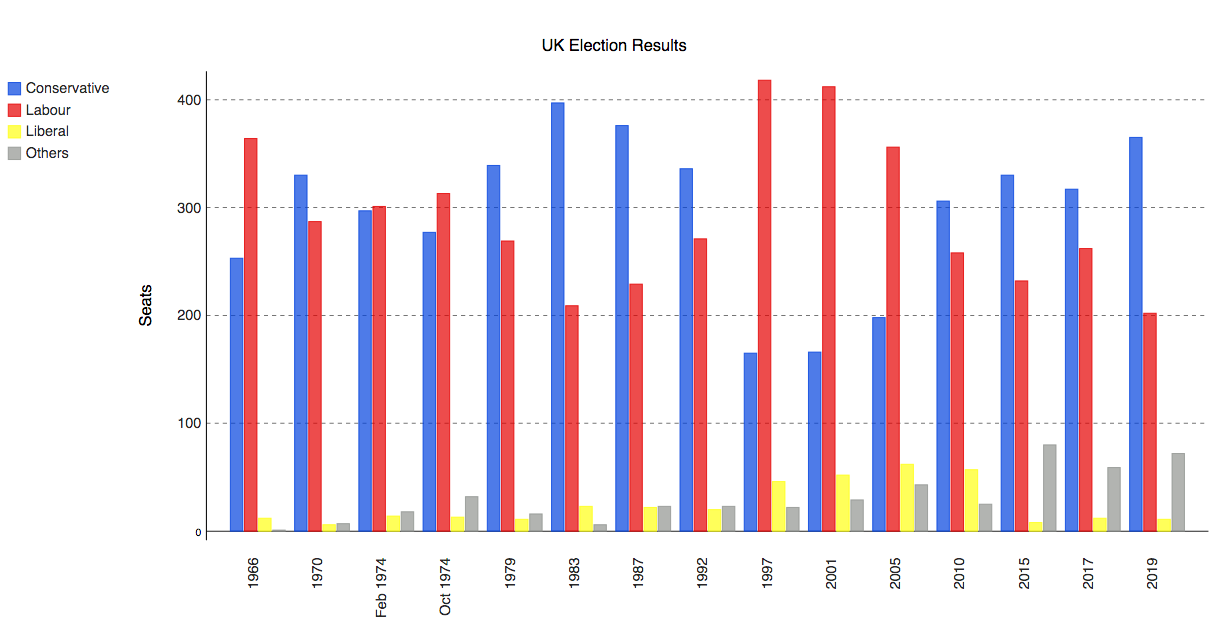
We’ll show you how to make this multi-bar plot:
Style first
We’re plotting the UK election results from 1966 to 2020 for each library, to pick out the differences between them. The data looks like this:
        year  conservative  labour  liberal  others
0       1966           253     364       12       1
1       1970           330     287        6       7
2   Feb 1974           297     301       14      18
..       ...           ...     ...      ...     ...
12      2015           330     232        8      80
13      2017           317     262       12      59
14      2019           365     202       11      72
Plotting this in Pygal is very simple. First, we create a Bar object and specify the style it will have:
    import pygal
    from pygal.style import Style

    custom_style = Style(
        colors=('#0343df', '#e50000', '#ffff14', '#929591'),
        font_family='Roboto,Helvetica,Arial,sans-serif',
        background='transparent',
        label_font_size=14,
    )

    c = pygal.Bar(
        title="UK Election Results",
        style=custom_style,
        y_title='Seats',
        width=1200,
        x_label_rotation=270,
)Then, we pass our data into the Bar object:
    from votes import wide as df

    c.add('Conservative', df['conservative'])
    c.add('Labour', df['labour'])
    c.add('Liberal', df['liberal'])
    c.add('Others', df['others'])

    c.x_labels = df['year']
Finally, we save the plot as an SVG file:
c.render_to_file('pygal.svg')The result is an interactive SVG plot:
Beautifully simple, and with beautiful results.
You can copy this example as an Anvil app here:
The simplest of all: Pandas
This is part of a rundown of Python plotting libraries. We’ve seen a few that are full-featured and dynamic, and a few that provide very clean, simple interfaces. Next we’ll look at the simplest of all: plotting directly from Pandas.
Plotting in Python
We're making the same plot in a range of Python plotting libraries.
Each library has a different strength - click the buttons below to learn more!