 By
By Add powerful Mapbox maps into your Anvil app
Mapbox is a powerful tool for building interactive customizable maps and integrating location and navigation data into your apps and websites. With Anvil, you can add Mapbox to your web apps entirely in Python - no JavaScript needed.
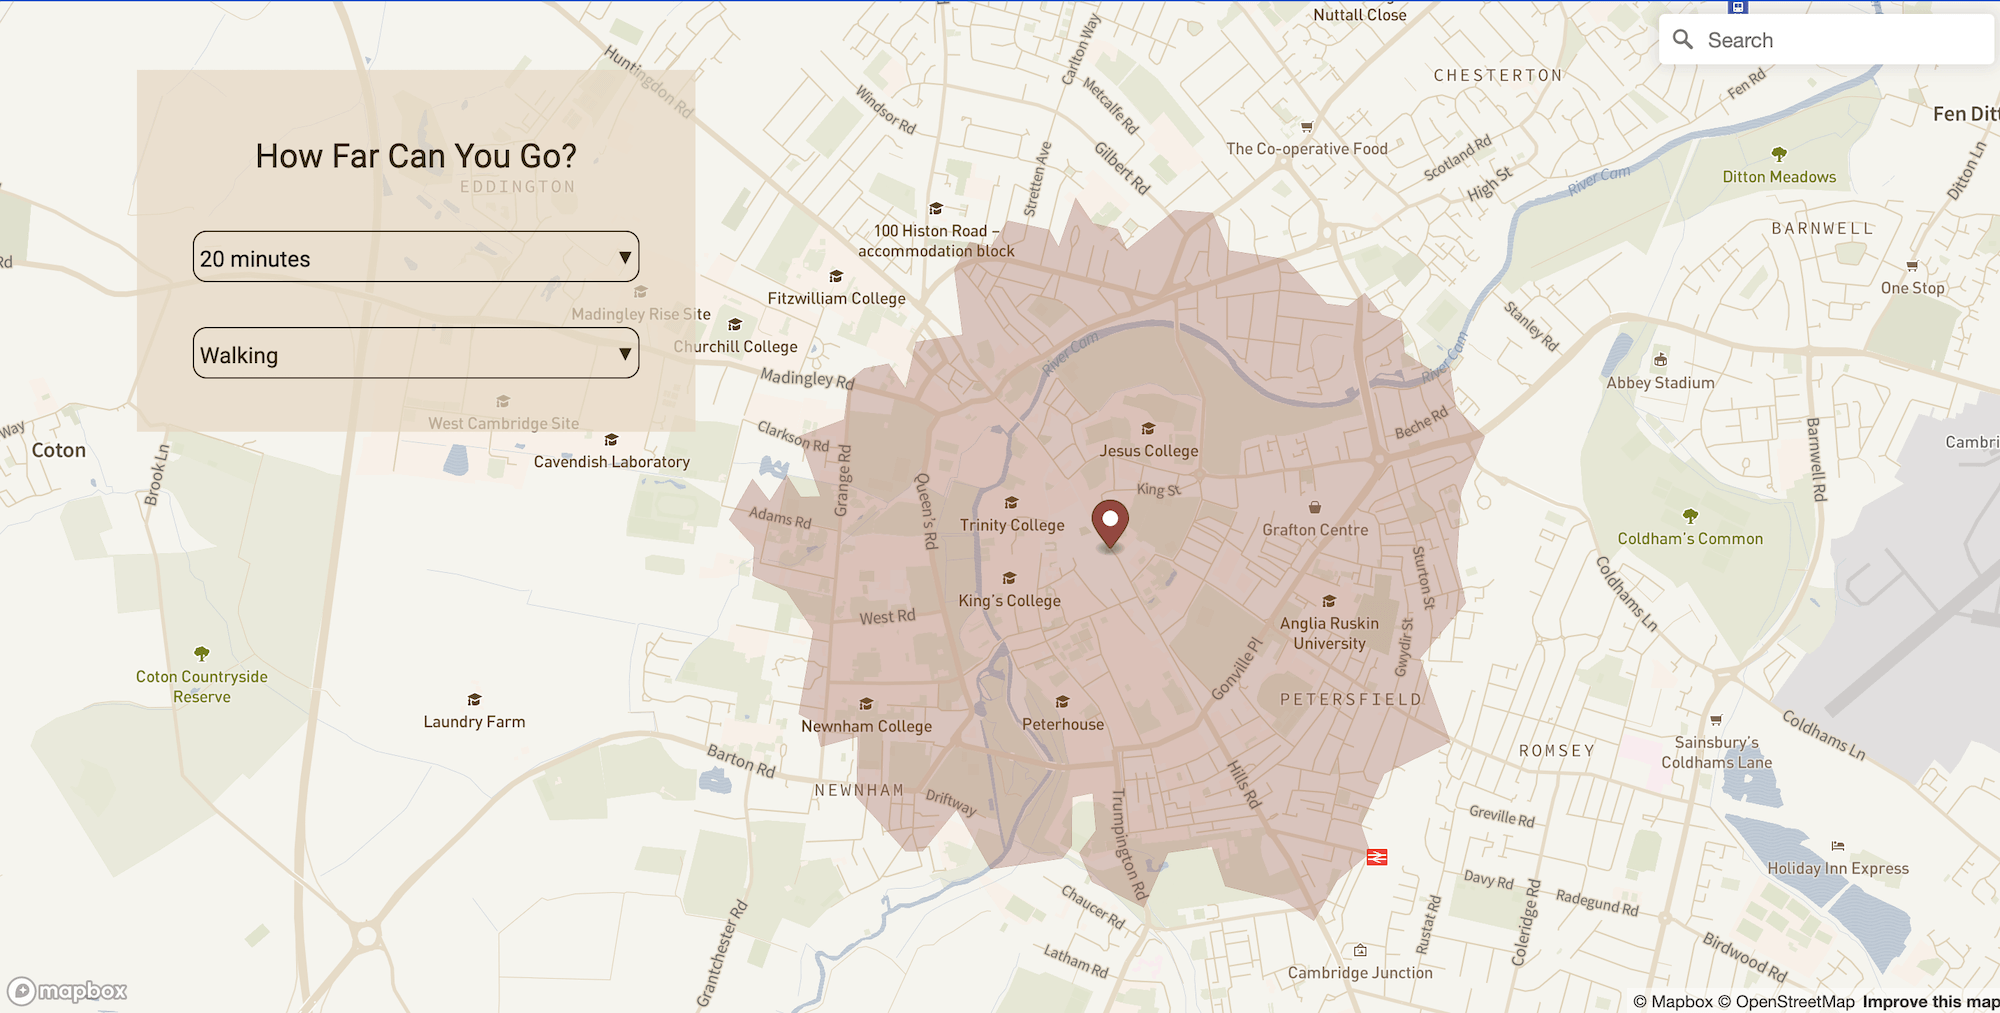
I’m going to show you how to build a web app, which uses Mapbox’s Isochrone API to estimate how far you can travel given a starting point and a certain amount of time. My app build is based on this tutorial, but requires no JS.
First, we’ll set up our app by creating a blank Anvil app, getting a Mapbox access key and adding a Map object to our new app. Next, we’ll add a geocoder to the app so that users can search for a location, and then we’ll use the Isochrone API estimate how far we can travel in a certain amount of time. Finally, we’ll build the UI for our app.
Let’s get started!
1. Set up the App and Mapbox Map
Create an Anvil app
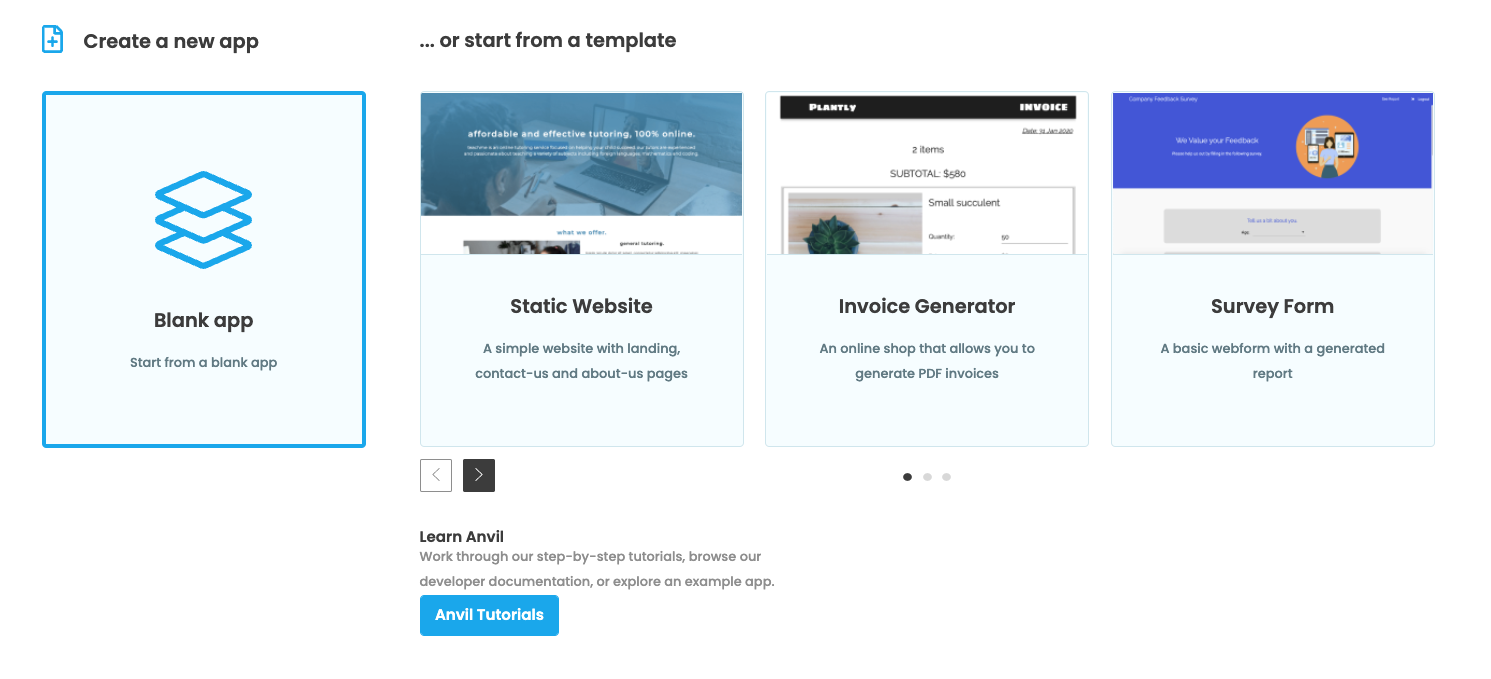
We first need to create a blank Anvil app:
Get a Mapbox access key
Next, we need to create a Mapbox account and get an access key. You can sign up for a free account at mapbox.com, which will give you a public access token.
Now that we have a Mapbox account and an access token, we can add a basic map to our Anvil app. This step is based on Mapbox’s quickstart tutorial.
We first need to add the Mapbox GL JS library and CSS file into our Anvil app. Add the following code to the Native Libraries section of your app:
<script src='https://api.mapbox.com/mapbox-gl-js/v2.1.1/mapbox-gl.js'></script>
<link href='https://api.mapbox.com/mapbox-gl-js/v2.1.1/mapbox-gl.css' rel='stylesheet' />
The blank Anvil app we created already has a Form (Form1) that will load when someone visits our app. In our Form1 code, we need to add the following import statements:
from anvil.js.window import mapboxgl
import anvil.js
import anvil.http
anvil.js.window allows us to access JS libraries in our Anvil app and interact with JS objects from Python. This way, we can still make use of Mapbox’s powerful JS library, but we can do it with Python.
Add a Map object
We need to add a placeholder component to our app that will hold our map. A Spacer works nicely because we can easily set the height. Drag and drop one from the Toolbox onto the form, and set its height to something reasonable.
We want the map to be displayed when the form is opened, so select the form and scroll down to the bottom of the Properties panel to create an event handler for the show event:
Adding a Spacer component and the form_show event
Anvil has created the form_show event handler for you, and this is where we want to write code to display our map.
In form_show, we first need to set our Mapbox access token then create a Mapbox Map object. We’ll pass in a dictionary that tells the Map object where it should be displayed (the Spacer component we added), how the map should be styled, where to center the map (as [longitude, latitude] coordinates) and how zoomed in the map should be.
def form_show(self, **event_args):
    """This method is called when the HTML panel is shown on the screen"""
    #I defined my access token in the __init__
    mapboxgl.accessToken = self.token

    #put the map in the spacer
    self.mapbox = mapboxgl.Map({'container': anvil.js.get_dom_node(self.spacer_1),
                                'style': 'mapbox://styles/mapbox/streets-v11', #use the standard Mapbox style
                                'center': [0.1218, 52.2053], #center on Cambridge
'zoom': 11})__init__ is called before adding the Form to the page, but the show event is triggered afterwards. (See more in the Anvil docs)Add a Marker object
Finally, we can add a Marker object to our map. We first need to create the object, give it a color and set draggable to True. Then we can set its [longitude, latitude] coordinates and add it to the map. This is added to the form_show event:
    self.marker = mapboxgl.Marker({'color': '#5a3fc0', 'draggable': True})
    self.marker.setLngLat([0.1218, 52.2053]).addTo(self.mapbox)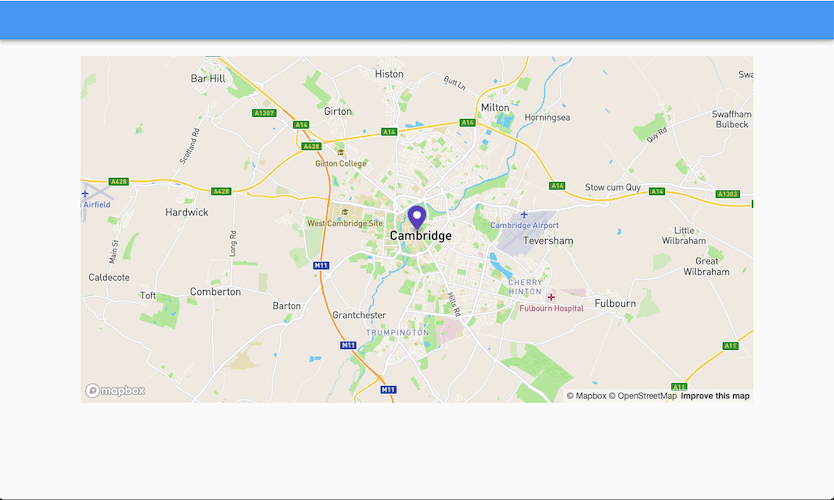
Mapbox map with a Marker added
2. Add a Geocoder
Mapbox’s Geocoding API allows us to easily turn location searches into longitude and latitude coordinates. We can use the Mapbox GL JS Geocoder plugin to add a search bar to our map. When a users searches for and selects a place, the map will fly over to this new location.
Import the geocoder
We first need to add the Mapbox Geocoder. In Native Libraries, add the following lines:
<script src='https://api.mapbox.com/mapbox-gl-js/plugins/mapbox-gl-geocoder/v4.2.0/mapbox-gl-geocoder.min.js'></script>
<link rel='stylesheet' href='https://api.mapbox.com/mapbox-gl-js/plugins/mapbox-gl-geocoder/v4.2.0/mapbox-gl-geocoder.css' type='text/css' />
Next, change the import statement you added in the previous step to also import MapboxGeocoder:
from anvil.js.window import mapboxgl, MapboxGeocoderAdd a geocoder to the map
Next we need to instantiate a MapboxGeocoder object by passing in our access token. Then we can add it to our map. The following code should be added to the form_show event:
    self.geocoder = MapboxGeocoder({'accessToken': mapboxgl.accessToken,
                                    'marker': False}) #we've already added a marker
    self.mapbox.addControl(self.geocoder)
Move the marker
We now have a geocoder added to our map. It will center the map to the location we search for, but it doesn’t move the marker. Let’s change that. We’ll write a function that gets the new coordinates from the geocoder and sets the marker to these coordinates after the user selects a location from the geocoder:
def form_show(self, **event_args):

    ...

    #when the 'result' event is triggered, call self.move_marker
    self.geocoder.on('result', self.move_marker)

def move_marker(self, result):
    #get the [longitude, latitude] coordinates from the JS object returned from 'result'
    lnglat = result['result']['geometry']['coordinates']
    self.marker.setLngLat(lnglat)
Searching for a location with the geocoder
3. Add the Isochrone API
Now that we have a map, a marker and a geocoder, we can calculate the isochrone lines that tell us how far we can travel given a specified amount of time.
To make the request to the Isochrone API, we need to pass in the profile (‘walking’, ‘cycling’ or ‘driving’), the coordinates of our starting point (as [longitude, latitude]) and the number of minutes we want to calculate the isochrone for (contours_minutes). We can get the longitude and latitude coordinates from our marker and collect the profile and minutes from the front-end of our app (we’ll build this in the next step).
def get_iso(self, profile, contours_minutes):
    lnglat = self.marker.getLngLat()
    response = anvil.http.request(f"https://api.mapbox.com/isochrone/v1/mapbox/{profile}/{lnglat.lng},{lnglat.lat}?contours_minutes={contours_minutes}&polygons=true&access_token={self.token}", json=True)
response will be a JSON object representing the isochrone lines we want to add to our map. In order to add these, we first need to add a Source, which tells the map which data it should display, and a Layer, which defines how to style the source data.
We should set the source and layer at the beginning of our get_iso function. Then after we get the response from the API, we can set that as the data for the source to display:
def get_iso(self, profile, contours_minutes):
    #we only want to create the source and layer once
    if not self.mapbox.getSource('iso'):
        self.mapbox.addSource('iso', {'type': 'geojson',
                                        'data': {'type': 'FeatureCollection',
                                                        'features': []}})
        self.mapbox.addLayer({'id': 'isoLayer',
                                'type': 'fill',
                                'source': 'iso', #the id of the source we just defined
                                'layout': {},
                                'paint': {
                                'fill-color': '#5a3fc0',
                                'fill-opacity': 0.3}})

    lnglat = self.marker.getLngLat()
    response = anvil.http.request(f"https://api.mapbox.com/isochrone/v1/mapbox/{profile}/{lnglat.lng},{lnglat.lat}?contours_minutes={contours_minutes}&polygons=true&access_token={self.token}", json=True)

    self.mapbox.getSource('iso').setData(response)
Let’s now build a front-end for our app so that users can specify an amount of time and a mode of travel.
4. Build the Front End
We can add two DropDown menus to our app so that users can select an amount of time and a mode of travel. Name the first DropDown time_dropdown and the other profile_dropdown.
Adding DropDown menus to the form
When we pass an amount of time as the contours_minutes argument to our get_iso function, we need it to be a number as a string (e.g. ‘10’). If we set time_dropdown.items from code, we can use a list of 2-tuples where the the first element of each tuple will be displayed in the DropDown and the second element will be the selected_value of the DropDown:
  def __init__(self, **properties):
    # Set Form properties and Data Bindings.
    self.time_dropdown.items = [('10 minutes', '10'), ('20 minutes', '20'), ('30 minutes', '30')]
The items for the profile_dropdown should be ‘walking’, ‘cycling’ and ‘driving’. These can be set directly in the Properties panel of the Editor or via code:
self.profile_dropdown.items = ['walking', 'cycling', 'driving']We now need to add event handlers so that get_iso is called whenever the value of a DropDown menu changes. For each DropDown on your form, scroll down to the bottom of the Properties panel to create an event handler for the change event. Then call get_iso with the selected values of the DropDowns as arguments to the function:
  def time_dropdown_change(self, **event_args):
      """This method is called when an item is selected"""
      self.get_iso(self.profile_dropdown.selected_value, self.time_dropdown.selected_value)

  def profile_dropdown_change(self, **event_args):
      """This method is called when an item is selected"""
      self.get_iso(self.profile_dropdown.selected_value, self.time_dropdown.selected_value)
Finally, we can also call get_iso when the Marker is dragged. We’ll do this just like we did in Step 2 when we caught the result event being triggered on the geocoder and moved the Marker. This time, we need to catch when the drag event is triggered on the Marker, then call get_iso:
  def form_show(self, **event_args):
      ...

      self.marker.on('drag', self.marker_dragged)

  def marker_dragged(self, drag):
      self.get_iso(self.profile_dropdown.selected_value, self.time_dropdown.selected_value)
And that’s it! We now have a fully working app built from the Mapbox Isochrone API that shows us how far we can travel in a specific amount of time. I made some changes to the style of my map and app, which I’ll show you how to do in the next (optional) step.
You can check out the full source code of the app here:
5. Optional: Style your app (Advanced)
To make my app look a bit nicer, I first changed the style of the Mapbox map.
This page lists Mapbox’s predefined styles, but you can also design your own in the Studio or choose from the gallery. I chose the style Frank from the gallery and added this to my account. After adding the style, you’ll be in Mapbox Studio. Click “Share” in the top menu and copy the ‘Style URL’. When instantiating your map, pass this URL as the map’s ‘style’.
I also changed the color of the Marker and the Isochrone fill to better match the ‘Frank’ style. I also set the height of the Spacer holding the map to 100vh so that the map would fill the entire page.
I then edited the app’s HTML to remove the app bar and add an extra <div> element that floats on top of the map. At the top of standard-page.html, I commented out the app-bar and added a floating-menu.
 <div class="structure">
<!--   <div class="app-bar" anvil-drop-container=".anvil-container" anvil-drop-redirect=".placeholder">
    <a class="sidebar-toggle" anvil-if-slot-empty="top-left-btn" anvil-hide-if-slot-empty="left-nav" anvil-drop-slot="top-left-btn" href="javascript:void(0)"><i class="fa fa-bars"></i></a>
    <a class="sidebar-toggle anvil-designer-only" anvil-if-slot-empty="top-left-btn" anvil-if-slot-empty="left-nav" anvil-drop-slot="top-left-btn"><i class="fa fa-blank"></i></a>
    <div class="top-left-btn" anvil-slot="top-left-btn"></div>
    <div class="title" anvil-slot="title">
      <div class="placeholder anvil-designer-only" anvil-if-slot-empty="title" anvil-drop-here>Drop title here</div>
    </div>
    <div class="app-bar-nav" anvil-slot="nav-right">
      <div class="placeholder anvil-designer-only" anvil-if-slot-empty="nav-right" anvil-drop-here>Drop a FlowPanel here</div>
    </div>
    <div style="clear:both"></div>
  </div> -->
  <div class="floating-menu" anvil-drop-here anvil-slot=".floating-menu">
  </div>
I added my DropDown menus to this floating element and edited its class in theme.css so that it’s background is transparent, and it stays fixed to the map:
.floating-menu {
  position: absolute;
  z-index: 100;
  min-height: 250px;
  min-width: 400px;
  margin: 50px 100px;
  padding: 30px 40px;
  background-color: rgba(229, 213, 194, 0.7);
}
More about Anvil
If you’re new here, welcome! Anvil is a platform for building full-stack web apps with nothing but Python. No need to wrestle with JS, HTML, CSS, Python, SQL and all their frameworks – just build it all in Python.
Learn More
Get Started with Anvil
Nothing but Python required!
Deploy data science to the web with Deepnote

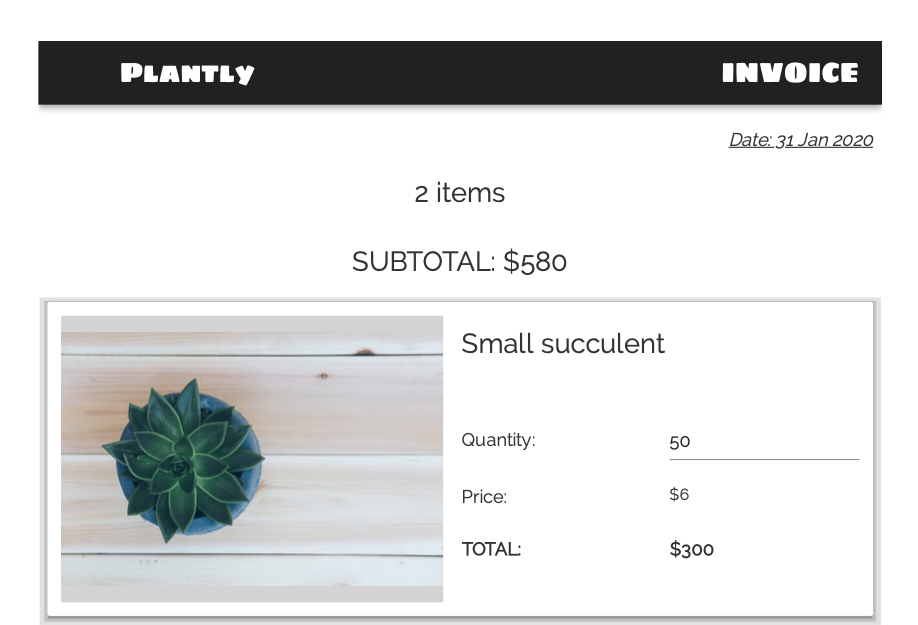
Generate PDF Invoices with Python
Python vs the Pandemic
2020 has been a difficult year for people all around the world.
We’ve seen an incredible response from the Anvil community, with a number of our users building tools and applications to help deal with the effects of the COVID-19 pandemic. We’ll take a look at some of the tools being built with Anvil to help people impacted by the virus.
Rapid Prototyping: Building Calendly in 3 Hours