 By
By Creating a Pure Python Web Dashboard with the QuickBooks API
QuickBooks is flexible, powerful accounting software, used by businesses and individuals alike. It also has a robust API - and I’m going to show you how to use it. We’re going to build a public dashboard, displaying company revenue by month.
We’re building it with Anvil, so we can build and deploy this app entirely in Python (no HTML or JavaScript required!). We’re not just driving the QuickBooks API with Python code – we’re building the front-end, including interactive plots in the browser, with Python too!
Here’s the finished app:
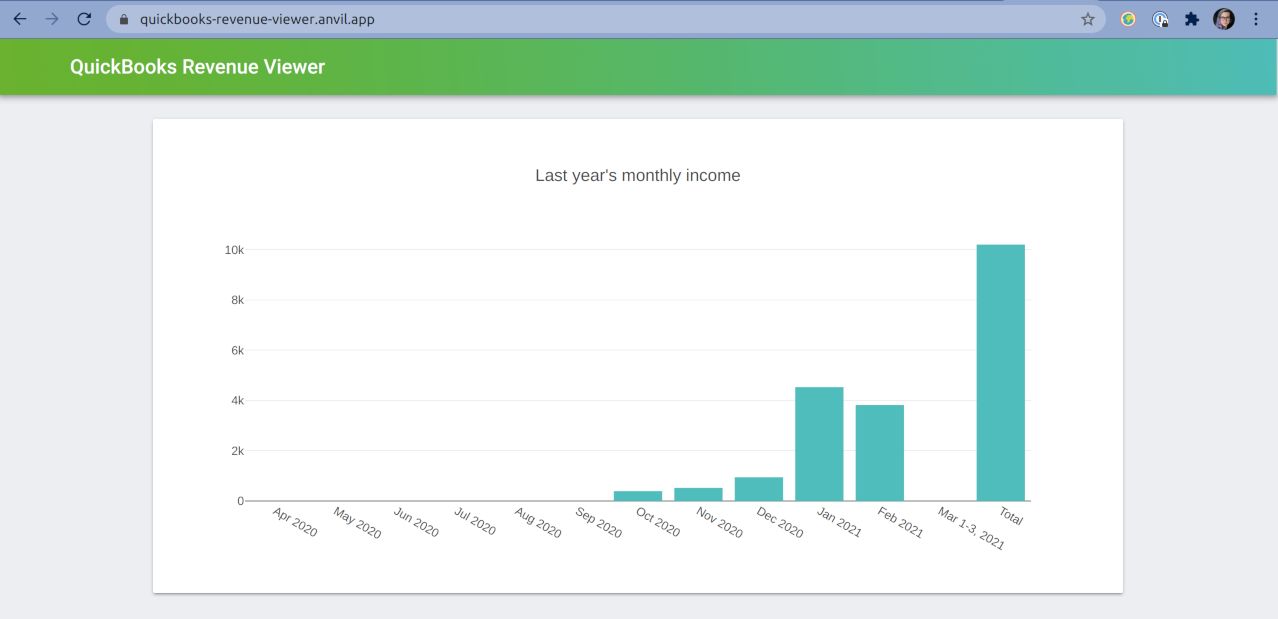
The app we’re going to build, showing company revenue over the last year by month.
Open the app here, or read on for a run-down of how it’s built!
Here’s how we put this dashboard together:
- Create our apps and set up credentials
- Authenticating and getting API tokens
- Calling the QuickBooks API to get our data
- Display our data to our users
You can open the app’s source code and follow along – just click below:
Ready? Let’s begin.
1. Setting up our apps and credentials
Note: This guide includes screenshots of the Classic Editor. Since we created this guide, we've released the new Anvil Editor, which is more powerful and easier to use.
All the code in this guide will work, but the Anvil Editor will look a little different to the screenshots you see here!
Creasting an Anvil app is fast and easy.
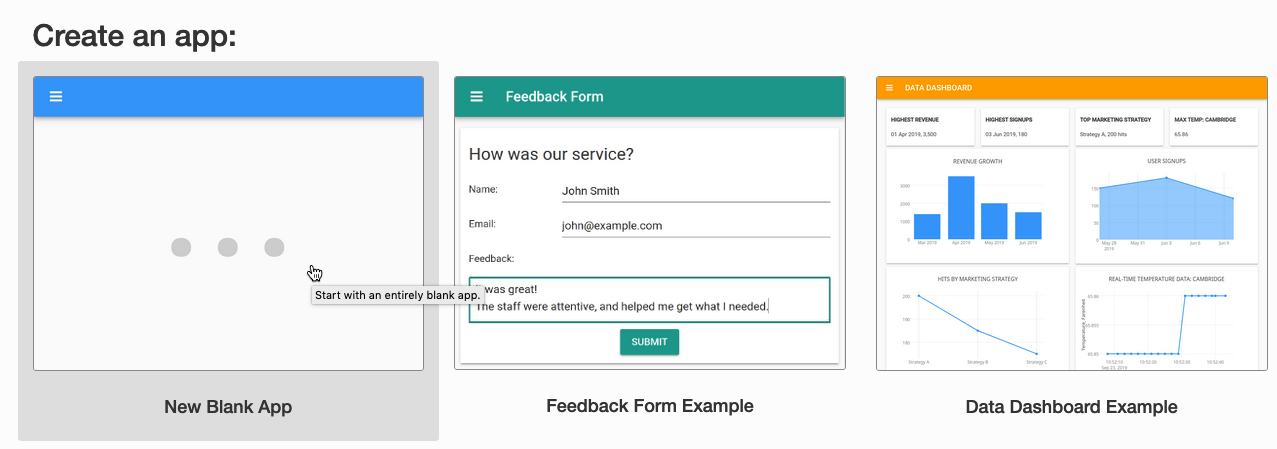
To get started, we just head to the Anvil App Editor, hit ‘New Blank App’ and choose ‘Material Design’. This gives us a layout where we can start dragging and dropping components, such as a title.
Then, deploying the app is as simple as clicking ‘Publish App’ in the app’s settings, choosing a URL, and hitting ‘Apply’.
Now our app is available to anyone on the web - but it’s not very exciting yet! To start pulling accounting data from Quickbooks, we’ll need to set up an account there too.
Creating an Intuit app to provide data to our Anvil app.
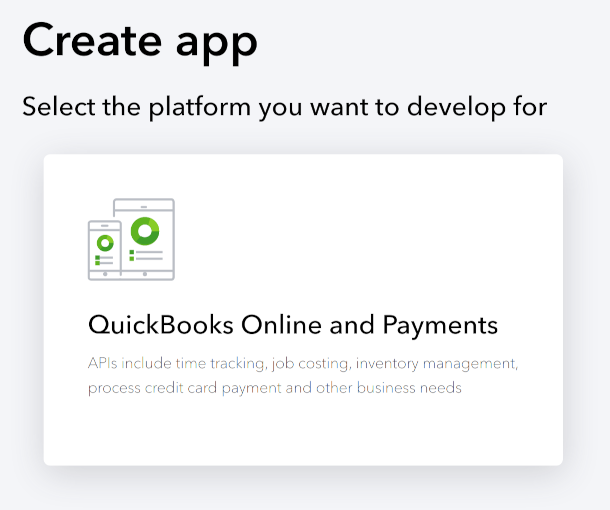
We head to the Intuit developer page and sign up there for a developer account. From there, we can create a sandbox company, which is a dummy company that comes pre-filled with some example accounting data.
Once we’ve got our sandbox company all set up, we go to the Dashboard to create an Intuit app. This is the entity that provides us with authentication details, so that our Anvil app can access our QuickBooks data.
Then, from the Dashboard, we can access the credentials from our Intuit app; we’re looking for a Client ID and Client Secret, and they can be found under the ‘Keys and OAuth’ section.
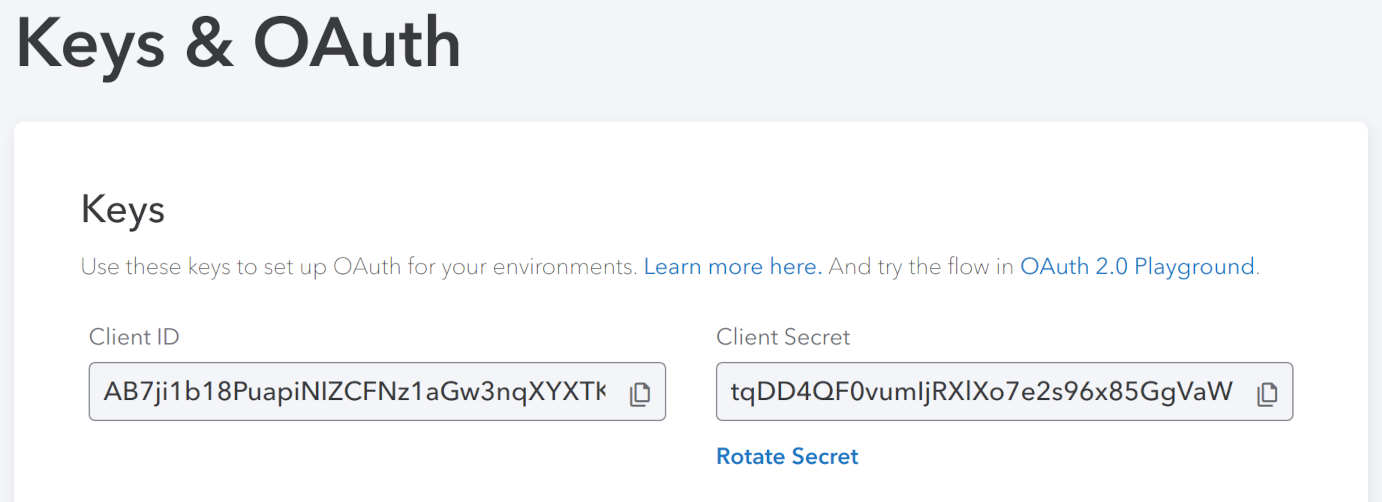
An example of the credentials we need.
We store these in our Anvil app as App Secrets, so we can access them later from code.
Now we’re armed with the credentials we need, we can get started on the authentication flow for our Anvil app!
2. Getting API tokens
To access the QuickBooks API, our app needs API tokens. We have to get those interactively (via OAuth), but they’re then valid for 100 days, so we can store them in our database and use them to fetch data whenever our app is opened. (We’re not going to get into a full OAuth tutorial here – you can see how it works in our app’s source code, or read a more detailed guide in the QuickBooks docs).
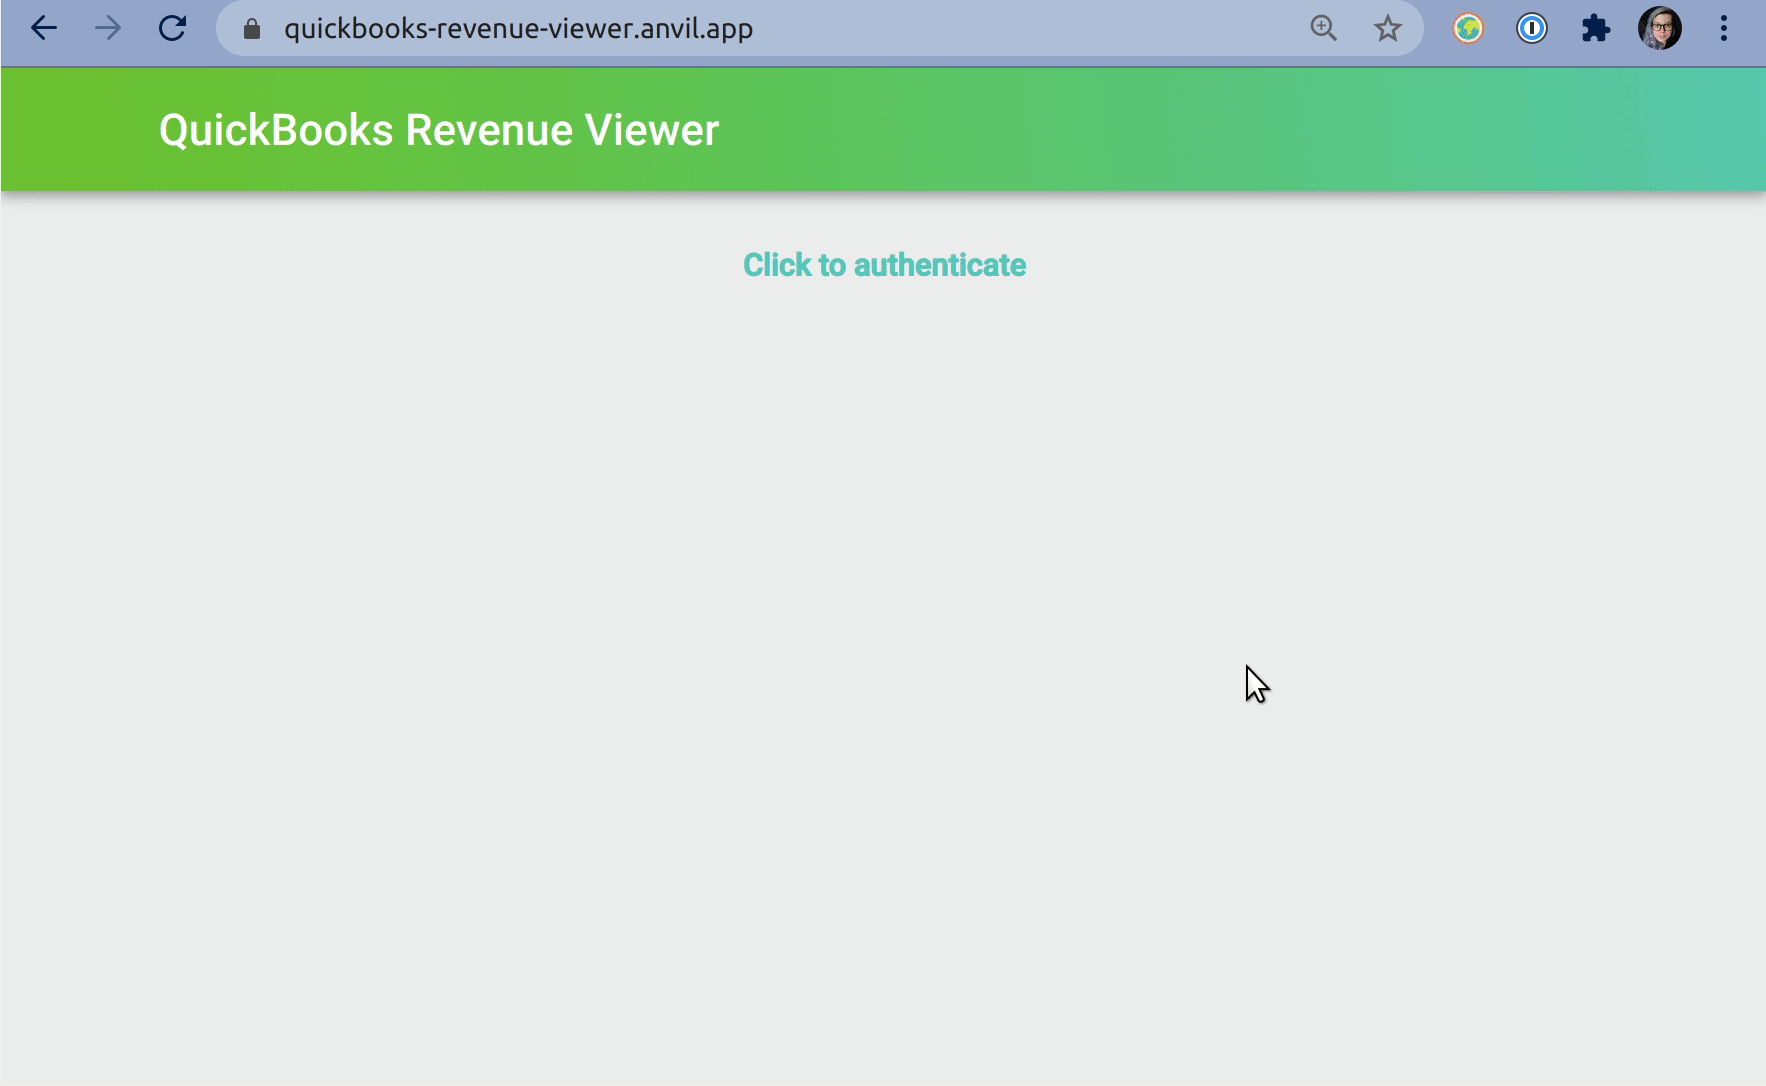
Authenticating our app for the first time with OAuth.
Once we have tokens, we store them in our app’s built-in database, using Anvil’s built-in encryption. When the token expires, we’ll need to repeat the OAuth login process, but that’s pretty quick:
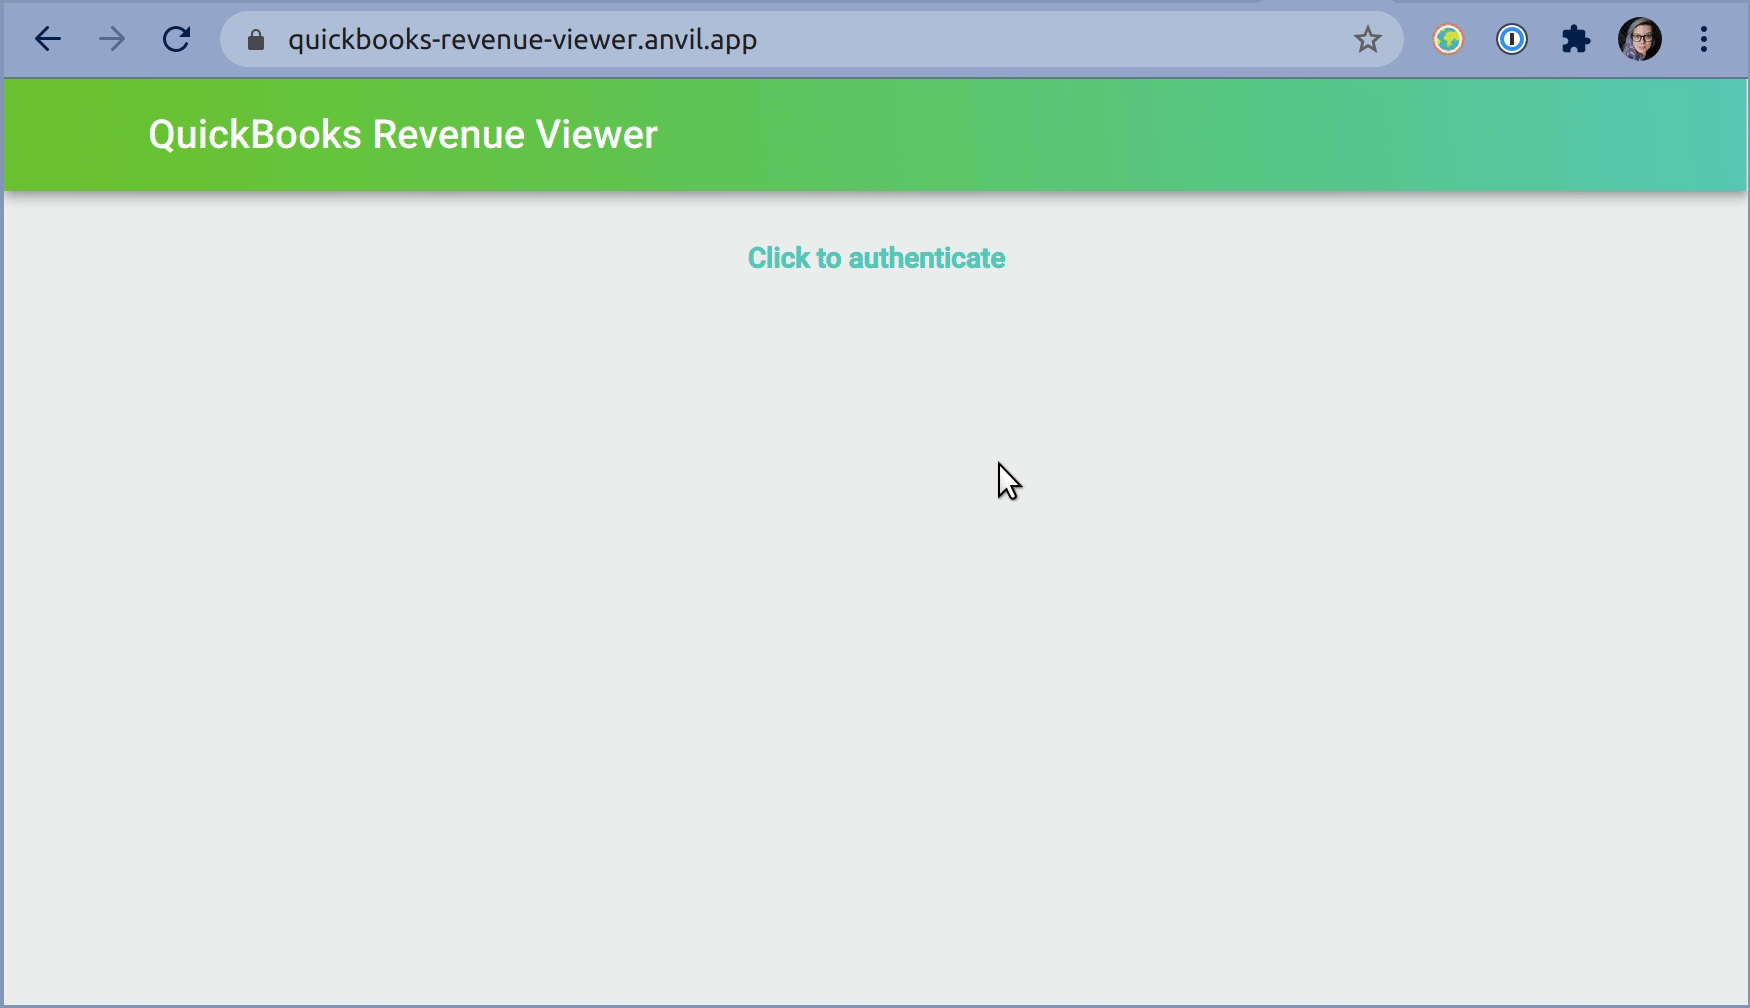
Reauthenticating - once we’ve already connected our two apps - is really fast!
3. Call the QuickBooks API
Now our app has all the credentials it needs to start making calls to the QuickBooks API. We’re going to use the ProfitAndLoss endpoint to retrieve data about our total income over the last year, grouped by month.
Here’s the server function:
@anvil.server.callable
def get_past_yearly_data():
  # The 'quickbooks_auth' table has one row, with all our tokens in. Fetch it:
  row = app_tables.quickbooks_auth.get()

  # Decrypt the Access Token
  access_token = anvil.secrets.decrypt_with_key('tokens_key', row['encrypted_access_token'])

  # Hit the ProfitAndLoss endpoint
  today = date.today()
  resp = requests.get(
    url=f'https://sandbox-quickbooks.api.intuit.com/v3/company/{row['realm_id']}/reports/ProfitAndLoss',
    headers={
      "accept": "application/json",
      "authorization": f"Bearer {access_token}",
      "content-type": "application/json",
    },
    params={
      'start_date': f'{today.year - 1}-{today.month + 1}-01',
      'end_date': today.isoformat(),
      'summarize_column_by': 'Month',
      'minorversion': "57"
    }
  ).json()

  # ...and now we just have to decode it...
Here we see the code for the API call; we get the access token from our Data Table and decrypt it, then make a GET request using the Python requests package.
The data that comes back is a little gnarly (here’s a sample), but it’s nothing we can’t fix with a few list comprehensions:
  months = [col["ColTitle"] for col in resp["Columns"]["Column"]][1:]
  summary = [col["Summary"] for col in resp["Rows"]["Row"] if col["Summary"]["ColData"][0]["value"] == "Total Income"][0]["ColData"][1:]
  incomes = [item["value"] for item in summary]

  return months, incomes
4. Display our data
Now for the easiest part: Call that get_past_yearly_data() function from the browser, and put the results into a Plotly chart.
We create a Plot component using Anvil’s drag-and-drop GUI editor, and call it revenue_plot:
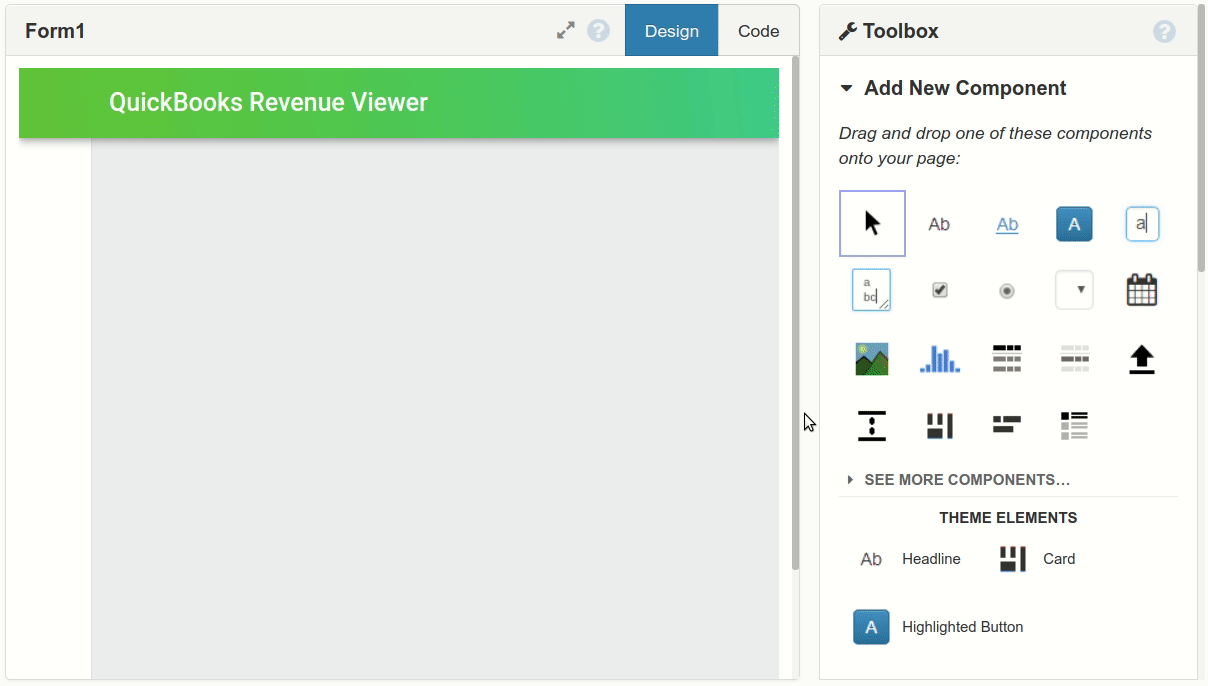
Creating a Plot component with the Anvil editor
Anvil lets us call server functions directly from browser code. Our server function returns two lists: one with all the months for which we have data, and one with the incomes for those months.
  # This code runs in the browser:
  months, incomes = anvil.server.call('get_past_yearly_data')
Now we can import the Plotly API:
import plotly.graph_objects as go…and make a bar chart:
self.revenue_plot.data = go.Bar(
    x = months,
    y = incomes,
    marker={'color': '#39bfbc'}
)

self.revenue_plot.layout = go.Layout(
    title=go.layout.Title(text="Last year's monthly income", x=0.5),
    yaxis_title="Income (USD)"
)
And that’s it! Here’s our finished app:
Our app, showing the data we got from our API call represented in a Plotly plot.
See the code
If you want to see the source code for this app, you can click the link below to clone it!
Go even further
Of course, we’ve only barely scratched the surface of what it’s possible to do with the QuickBooks API. Using this framework, you could build a fully featured dashboard and make much more use of Plotly’s interactive features. Have a go at extending what we’ve built today!
More about Anvil
If you’re new here, welcome! Anvil is a platform for building full-stack web apps with nothing but Python. No need to wrestle with JS, HTML, CSS, Python, SQL and all their frameworks – just build it all in Python.
Learn More
Get Started with Anvil
Nothing but Python required!
Deploy data science to the web with Deepnote
Generate PDF Invoices with Python
Python vs the Pandemic

2020 has been a difficult year for people all around the world.
We’ve seen an incredible response from the Anvil community, with a number of our users building tools and applications to help deal with the effects of the COVID-19 pandemic. We’ll take a look at some of the tools being built with Anvil to help people impacted by the virus.
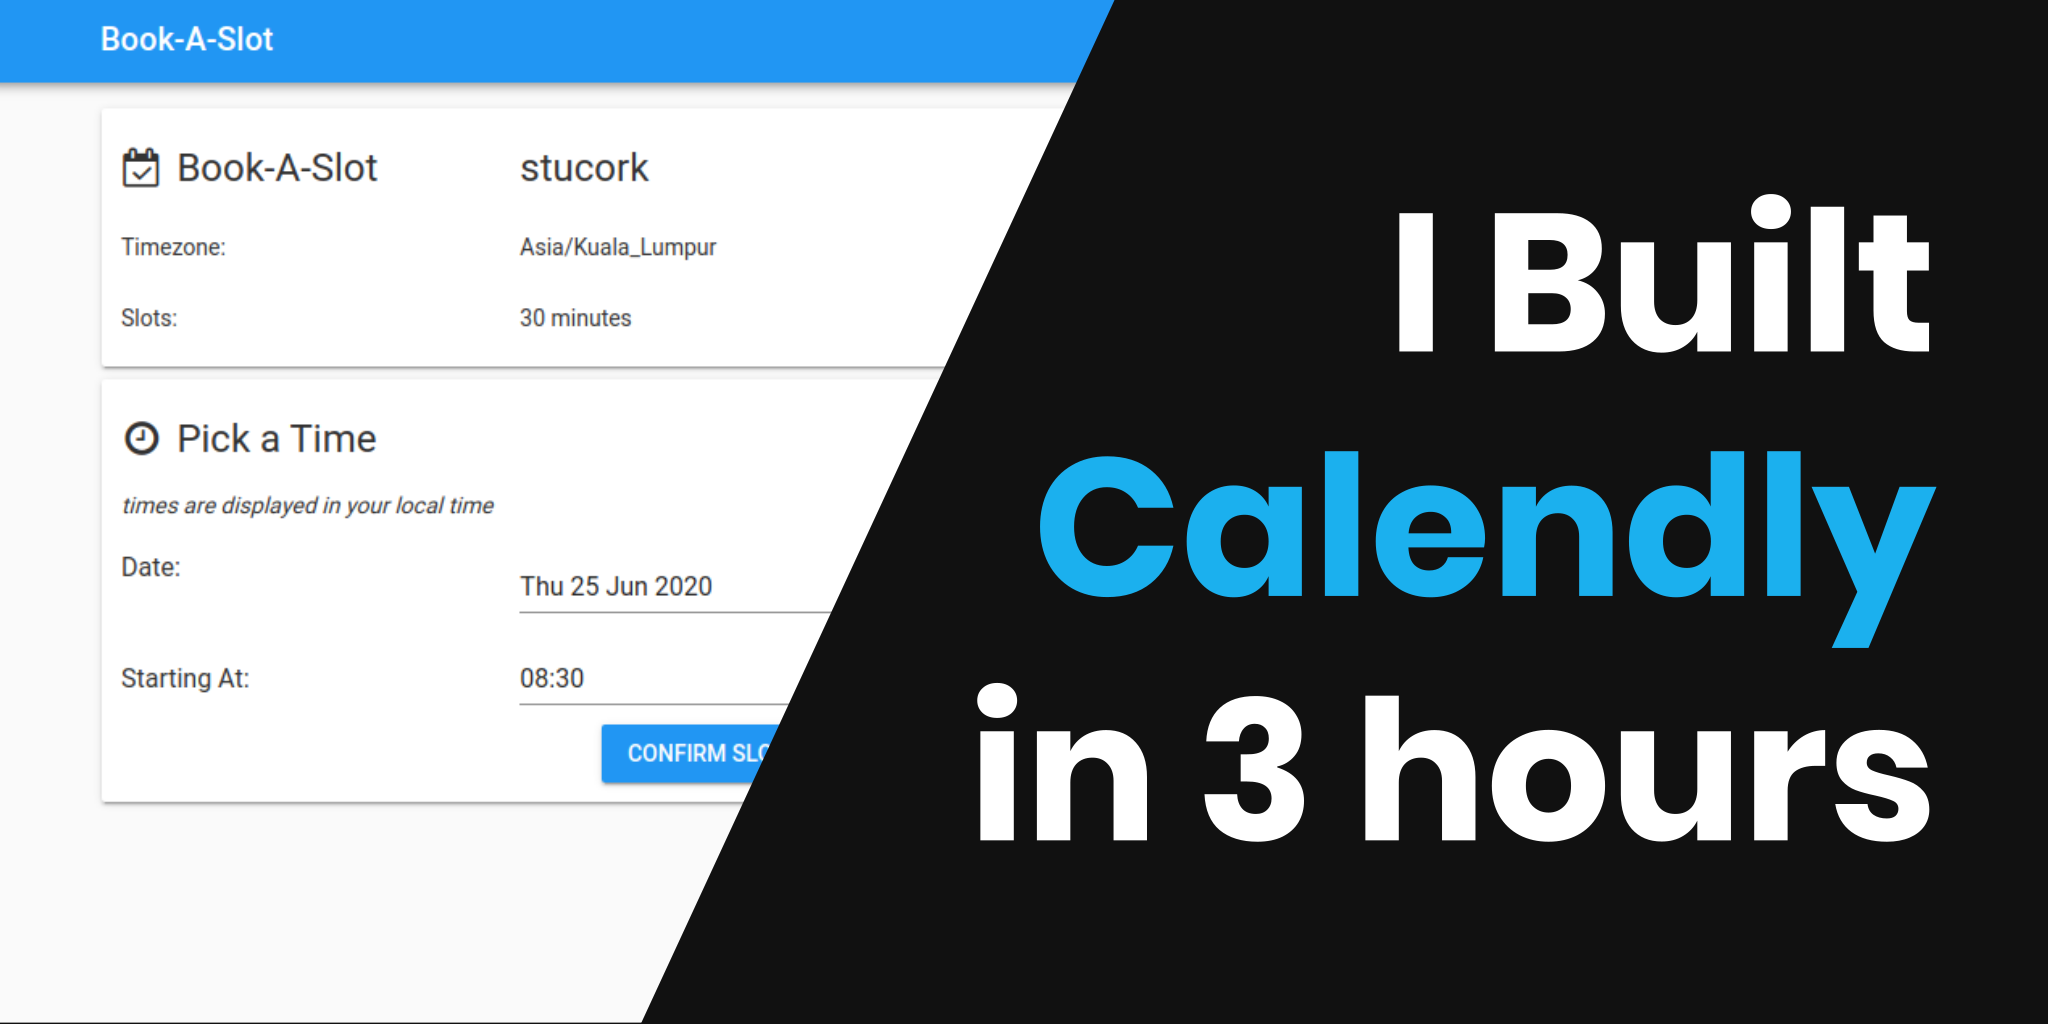
Rapid Prototyping: Building Calendly in 3 Hours