 By
By Draw beautiful charts with FusionCharts and Anvil
FusionCharts is a library for building beautiful dashboards in the browser, and with Anvil you can build your FusionCharts dashboard entirely in Python, no HTML or JS required!
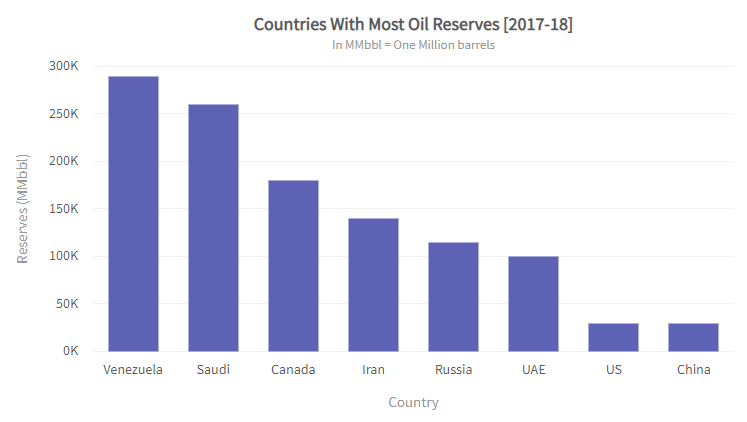
The chart we’re going to create.
Let’s jump in and build the standard FusionCharts demo plot in Anvil. Here’s the plan:
- Create an Anvil app
- Add the FusionCharts library
- Create a FusionChart plot in Python
- Bonus: Add an event handler to the plot
- Deploy your app to the web
1. Create an Anvil app
Note: This guide includes screenshots of the Classic Editor. Since we created this guide, we've released the new Anvil Editor, which is more powerful and easier to use.
All the code in this guide will work, but the Anvil Editor will look a little different to the screenshots you see here!
We’re going to start with a blank app, built from Anvil’s Material Design theme:
Create a new Anvil app.
2. Add the FusionCharts library
FusionCharts is distributed as a Javascript library, so we’ll add that to our app in the Native Libraries section:
<script type="text/javascript" src="https://cdn.fusioncharts.com/fusioncharts/latest/fusioncharts.js"></script>
<script type="text/javascript" src="https://cdn.fusioncharts.com/fusioncharts/latest/themes/fusioncharts.theme.fusion.js"></script>
That’s all the HTML we have to write - the rest of our app will be written entirely from Python!
3. Create a FusionCharts plot in Python
The blank app we created already has a form (Form1) that will load when someone visits our app, so let’s add a placeholder component to hold the plot. A Spacer works nicely. Drag and drop one from the Toolbox onto the form, set the height to something suitable, and rename it to chart_placeholder:
Create a placeholder for your chart.
We want to display the chart when the form is opened, so select the form and then scroll down to the bottom of the Properties panel to create an event handler for the show event:
Create an event handler for the form ‘show’ event.
Anvil has created the form_show event handler for you, and this is where we want to write code to display our chart. Before we get to that, let’s import the things we need. We’ll be using the anvil.js module to interact with the FusionCharts Javascript, so start by importing that at the top of the file. At the same time, let’s add the data we want to plot:
...
from anvil import *
import anvil.js # Add this import

chart_data = [{
    "label": "Venezuela",
    "value": "290"
  },{
    "label": "Saudi",
    "value": "260"
  },{
    "label": "Canada",
    "value": "180"
  },{
    "label": "Iran",
    "value": "140"
  },{
    "label": "Russia",
    "value": "115"
  },{
    "label": "UAE",
    "value": "100"
  },{
    "label": "US",
    "value": "30"
  },{
    "label": "China",
    "value": "30"
  }
]

#
class Form1(Form1Template):
  ...
Now update your new form_show event handler to create the chart:
  def form_show(self, **event_args):
    """This method is called when the form is shown on the screen"""

    chart = anvil.js.window.FusionCharts({
      "renderAt": anvil.js.get_dom_node(self.chart_placeholder),
      "type": "column2d",
      "width": "100%",
      "height": "100%",
      "dataSource": {
        "chart": {
          "caption": "Countries With Most Oil Reserves [2017-18]",
          "subCaption": "In MMbbl = One Million barrels",
          "xAxisName": "Country",
          "yAxisName": "Reserves (MMbbl)",
          "numberSuffix": "K",
          "theme": "fusion",
        },
        "data": chart_data,
      },
    })

    chart.render()
And that’s it! Hit “Run” to see your chart. It should look something like this:
Yours should look the same!
4. Bonus step: Add an event handler to your plot
FusionCharts are fully interactive, and we can easily wire up their events to Python methods in our app. Let’s pop up an alert when the user clicks one of the bars on the plot.
First, we’ll add a method to our form to handle the event:
  def data_plot_click(self, event, data):
    alert(f"You clicked on {data.categoryLabel}, which has a value of {data.displayValue}")
Then we need to modify our chart generation code to pass the method to FusionCharts:
  def form_show(self, **event_args):
    """This method is called when the form is shown on the screen"""

    chart = anvil.js.window.FusionCharts({
      "renderAt": anvil.js.get_dom_node(self.spacer_1),
      "type": "column2d",
      ## Add this section to register our new event handler
      "events": {
        "dataplotclick": self.data_plot_click
      }
      "width": "100%",
      "height": "100%",
    ...
That’s all we need. Run your app again, and try clicking on one of the bars to see the popup.
5. Deploy your app to the web
Anvil makes it really easy to publish your new FusionCharts dashboard to the web. Deploying the app is as simple as clicking ‘Publish App’ in the app’s settings and choosing a URL:
Choosing a URL and deploying our new app to it.
Now our app is available to anyone on the web!
That’s it!
We’ve just created a web app with nothing but Python, even though the FusionCharts library usually requires Javascript!
Check out the full source code of the app here:
More about Anvil
If you’re new here, welcome! Anvil is a platform for building full-stack web apps with nothing but Python. No need to wrestle with JS, HTML, CSS, Python, SQL and all their frameworks – just build it all in Python.
Learn More
Get Started with Anvil
Nothing but Python required!
Seven ways to plot data in Python
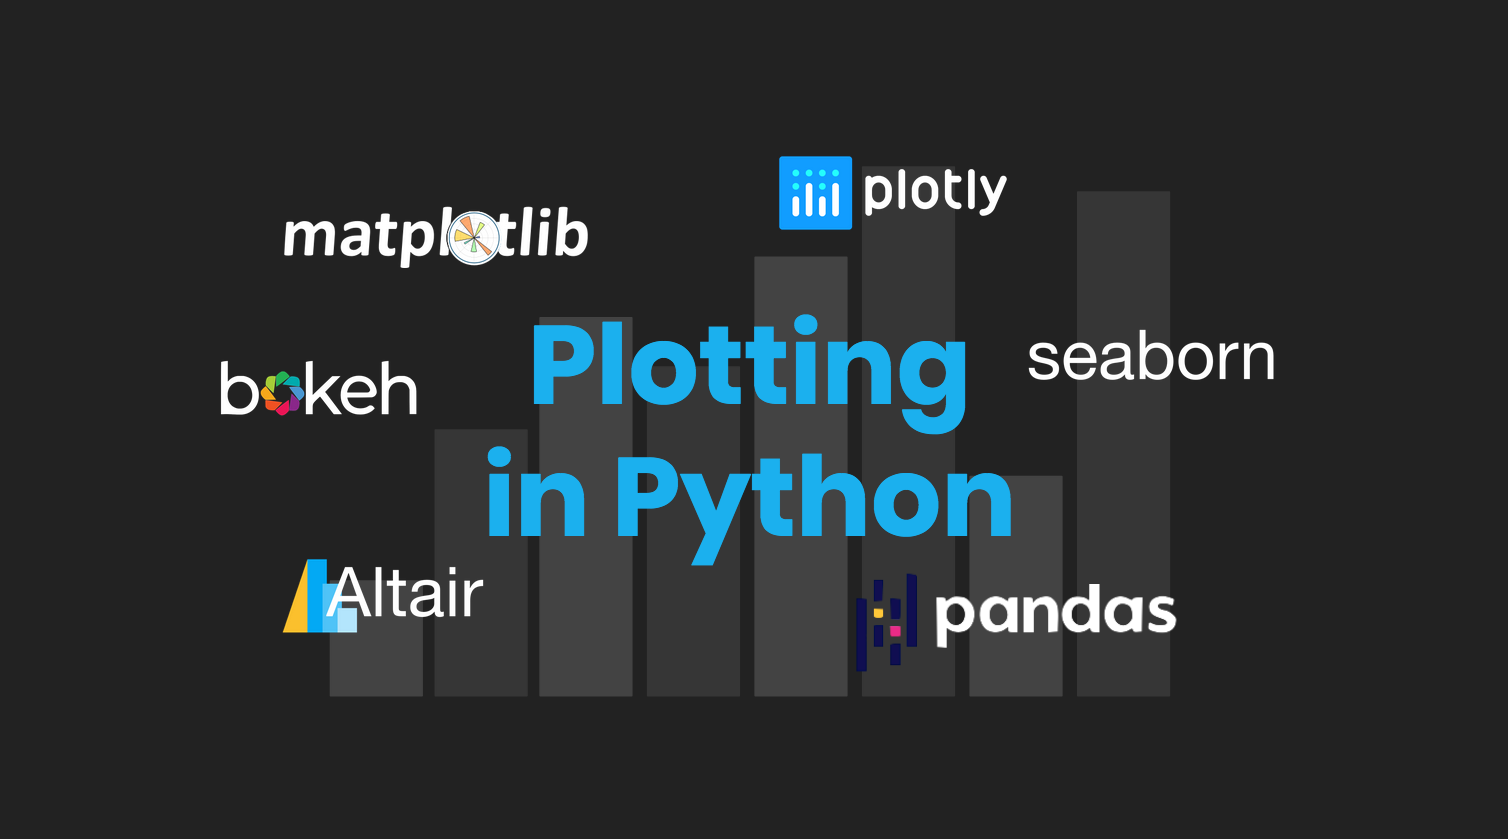
Python is the language of Data Science, and there are many plotting libraries out there.
Which should you choose?
In this guide, we introduce and explain the best-known Python plotting libraries, with a detailed article on each one.
Deploy data science to the web with Deepnote

Generate PDF Invoices with Python
Rapid Prototyping: Building Calendly in 3 Hours