
 By
By This blog post is courtesy of BasisPoint. BasisPoint is a startup that specialises in translating financial data into insights. They deliver tailor-made solutions to institutional investors, asset managers and hedge funds by automating and streamlining error-prone, complex and labour-intensive processes.
Want to hear how they do it? Check out the BasisPoint interview on the Anvil Podcast.
A Swap Pricing Calculator Built with QuantLib and Anvil
QuantLib is one of the largest and most popular open-source libraries for quantitative finance. It is used by banks, asset managers and other financial parties worldwide. Potentially billions of USD are traded every day based on analytics performed by QuantLib. At BasisPoint it is one of our most important tools (next to Anvil).
In this post, we will demonstrate how you can build an Anvil app that uses QuantLib to perform valuations and sensitivity analysis on one of the most common instruments, an interest rate swap (IRS). This app is a demo of the kinds of tailor-made analytical tools BasisPoint provides to clients.
What are Interest Rate Swaps?
An interest rate swap (IRS) is when two parties exchange, or swap, interest rate payments. In the most basic type of IRS, called a vanilla IRS, two parties agree to pay each other’s interest for a specified amount of money and time. One party (the payer) agrees to pay a fixed rate interest rate, while the other party (the receiver) pays a variable interest rate. Interest rate swaps are used by institutions such as pension funds, insurers, large corporations and banks to mitigate the risk of changing interest rates.
Interest rate swaps are bespoke financial products, so they can vary greatly. For example, the frequency of payment will differ from one IRS to the next. Keeping track of them thus requires extensive modelling. Some the key metrics that can be modelled are the net present value (NPV) of the swap and the risks associated with the NPV when the underlying interest rates change. QuantLib is used by trained quantitative analysts for modelling, trading and risk management. In this app, we’ll use it to perform valuations and sensitivity analysis on interest rate swaps.
The Financial Calculator App
Adding swaps
In the app, swaps are added then displayed using a Data Grid to create a simple swap portfolio.
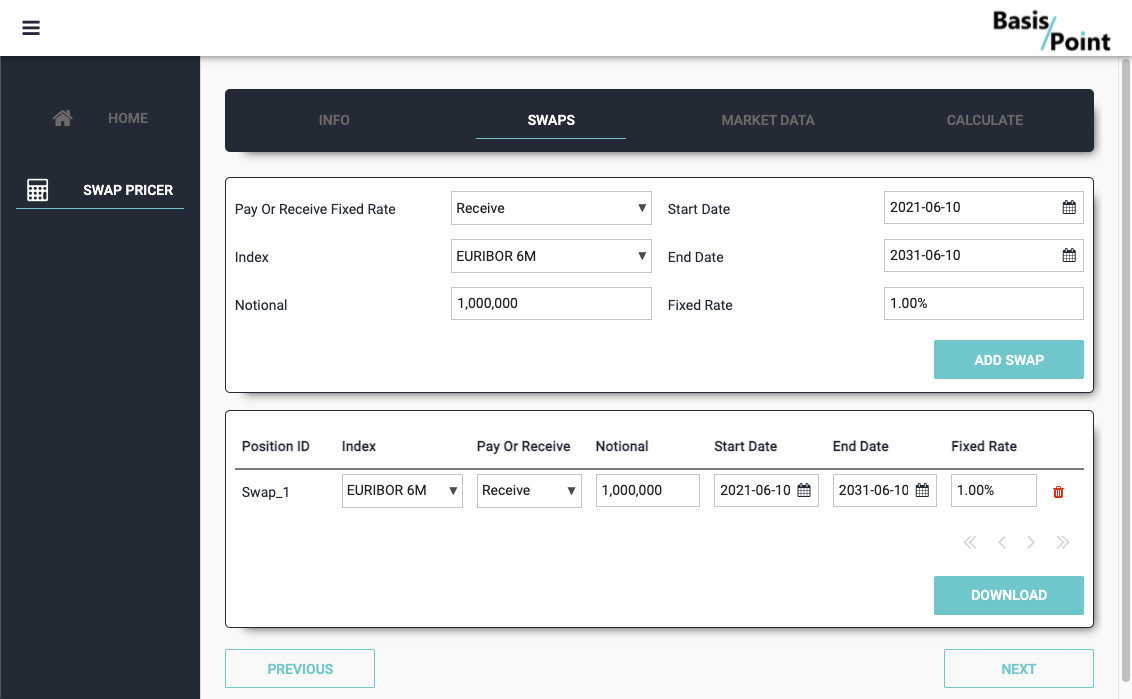
The portfolio can be downloaded and opened in Excel. A server function uses pandas to convert the Data Grid to Excel format. This can then be converted to a Media object and downloaded to the user’s computer by calling download() from the client code.
@anvil.server.callable
def export_to_excel(file_name, data, columns=None):
  #data is the rows from the data grid
  df = pd.DataFrame(data, columns=columns)
  bytes_io = io.BytesIO()
  df.to_excel(bytes_io, index=False)

  #return the excel sheet as a media object
  return anvil.BlobMedia(
    content_type='application/vnd.openxmlformats-officedocument.spreadsheetml.sheet',
    content=bytes_io.getvalue(),
    name=file_name)
Plotting market data
Next, the app can be used to plot swap curves, which show the potential returns of an IRS based on how long they take to mature. Swap curves are needed to value a swap. Plotting the curves with Plotly turns the data into an interactive graph.
The swap curves are constructed with Quantlib by using an interpolation algorithm to calculate a smooth swap curve from observed market data. When plotting the swap curves, the app allows you to choose an interpolation method. These methods, linear zeros, linear log discounts, cubic zeros or cubic log discounts, are calculated using QuantLib.
INTERPOLATION_MAP = {
    'Linear Zeroes':
    lambda s, h: ql.PiecewiseLinearZero(s, h, ql.Actual365Fixed()),
    'Linear Log Discounts':
    lambda s, h: ql.PiecewiseLogLinearDiscount(s, h, ql.Actual365Fixed()),
    'Cubic Zeroes':
    lambda s, h: ql.PiecewiseCubicZero(s, h, ql.Actual365Fixed()),
    'Cubic Log Discounts':
    lambda s, h: ql.PiecewiseLogCubicDiscount(s, h, ql.Actual365Fixed())}
Calculating interest rate sensitivity
The final tab of the app allows you to calculate the interest rate sensitivity (DV01) of the NPV of a swap over time. DV01 is an approximation of the change in an asset’s NPV due to changes in the interest rate environment. The DV01s are calculated by first taking the original NPV of the swap. Then, each rate on the interest rate curve is adjusted with a small bump and the NPV is recalculated. The difference between the “bumped” value and the original value of the swap (adjusted for the size of the bump) is the DV01 for that particular change on the curve.
def calculate_deltas(quotes, nodes, swap, bump):
    #deltas will be the calculated changes in NPV (DV01s)
    deltas = []
    npv = swap.NPV() #original NPV
    for q, n in zip(quotes, nodes):
        v = q.quote_handle.value() #value of interest rate curve
        #value is bumped by a fixed value
        q.quote_handle.linkTo(ql.SimpleQuote(v + bump))
        bumped_npv = swap.NPV() #calculate new NPV
        q.quote_handle.linkTo(ql.SimpleQuote(v))
        #calculate change in NPV adjusted for bump
        delta = (bumped_npv - npv) / bump * 1.0e-4
        #ttm is time to maturity
        deltas.append({'ttm': n, 'amount': delta})
    return deltas
The calculated deltas are then plotted in an interactive bar chart using Plotly:
def results_to_plot(self, results):
    data = []
    for r in results:
      x_values = []
      y_values = []
      for c in r['deltas']:
        #x values will be the time to maturity
        x_values.append(c['ttm'])
        #y value is DV01 amount
        y_values.append(c['amount'])
      data.append({'name': f'{r["id"]}', 'x_values': x_values, 'y_values': y_values})
    self.plot_deltas.plot(data=data)
    self.column_panel_plot.visible = True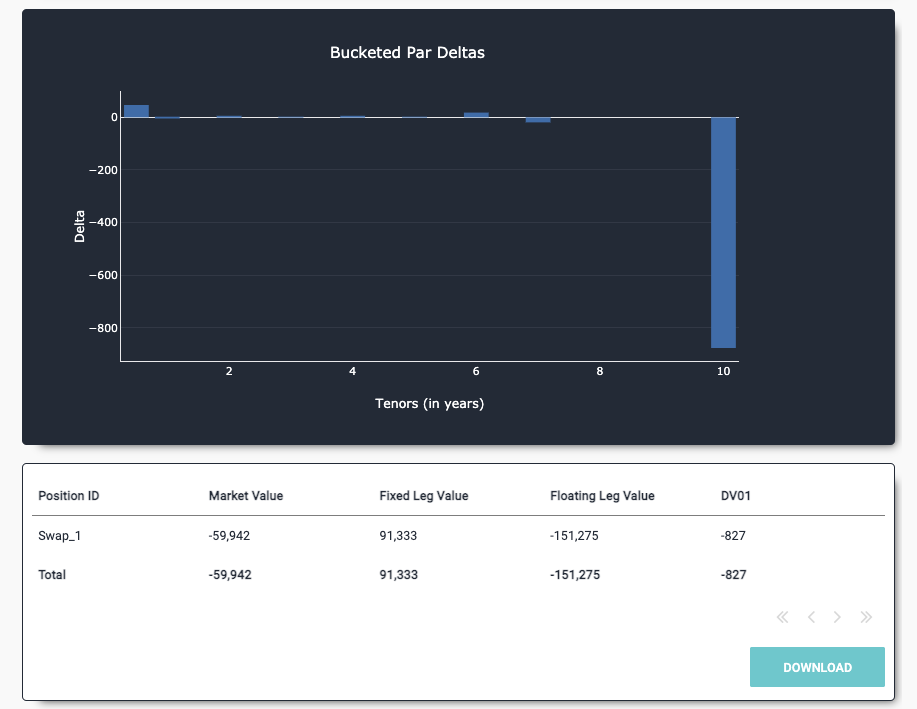
Learn more
Interested in finding out more about BasisPoint and the services they offer? Check out their website at https://www.basispoint.io/en.
Be sure to check out the Anvil podcast where the BasisPoint team recently sat down with Anvil’s founder to discuss building bespoke financial tools for a modern world.
Anvil is a platform for building full-stack web apps with nothing but Python. No need to wrestle with JS, HTML, CSS, Python, SQL and all their frameworks – just build it all in Python.
Want to build an app of your own? Get started with one of our tutorials:
Data Dashboard
Build Database-Backed Apps
Build a Simple Feedback Form
Build a data-entry app, and learn the techniques fundamental to building any Anvil app. In this tutorial, you will:
- Build your User Interface
- Write client-side Python
- Write server-side Python
- Store data in a database
- Deploy your app