Using Plotly Express to build your figures
In this guide, you will learn how to use Plotly Express in Anvil, by creating figures on the server side and feeding them to plots on the client side. If you’re interested in using other plotting libraries, take a look at our Making plots guide.
plotly.express module is only available to the server on a Personal plan and above, or on a Full Python interpreter trial. You can still use it on the Free Plan by connecting to your own back-end using the Uplink.Construct the figure
The first thing we need to do is to create our UI and place a Plot component on it.
Now, we need to build the plot that is going to be displayed inside our component. Most Python libraries do not work on the client side, so we won’t be able to use Plotly express directly in our client Form. Instead, we will create our figures on the server and then send them to the client.
In this guide, we’re going to be plotting data from the Iris dataset, included in the plotly.express.data package. Let’s start by creating a Server Module and, at the top, importing Plotly Express. After this, we need to create a function in which we’ll build and return our figure, and we’ll decorate it as @anvil.server.callable.
import plotly.express as px

@anvil.server.callable
def create_fig():
    data = px.data.iris()
    fig = px.scatter(data, x="sepal_width", y="sepal_length", color="species", trendline="ols")
    return fig
Display the figure in your UI
Go back to your client form code and call your server function inside the __init__ method. This will output the function that we created as a Media Object, which we can set as the figure method of our plot component.
  class Form1(Form1Template):
      def __init__(self, **properties):
          self.init_components(**properties)

          fig = anvil.server.call('create_fig')
          self.plot_1.figure = fig
When you run your app, your figure will be displayed inside your Plot component.
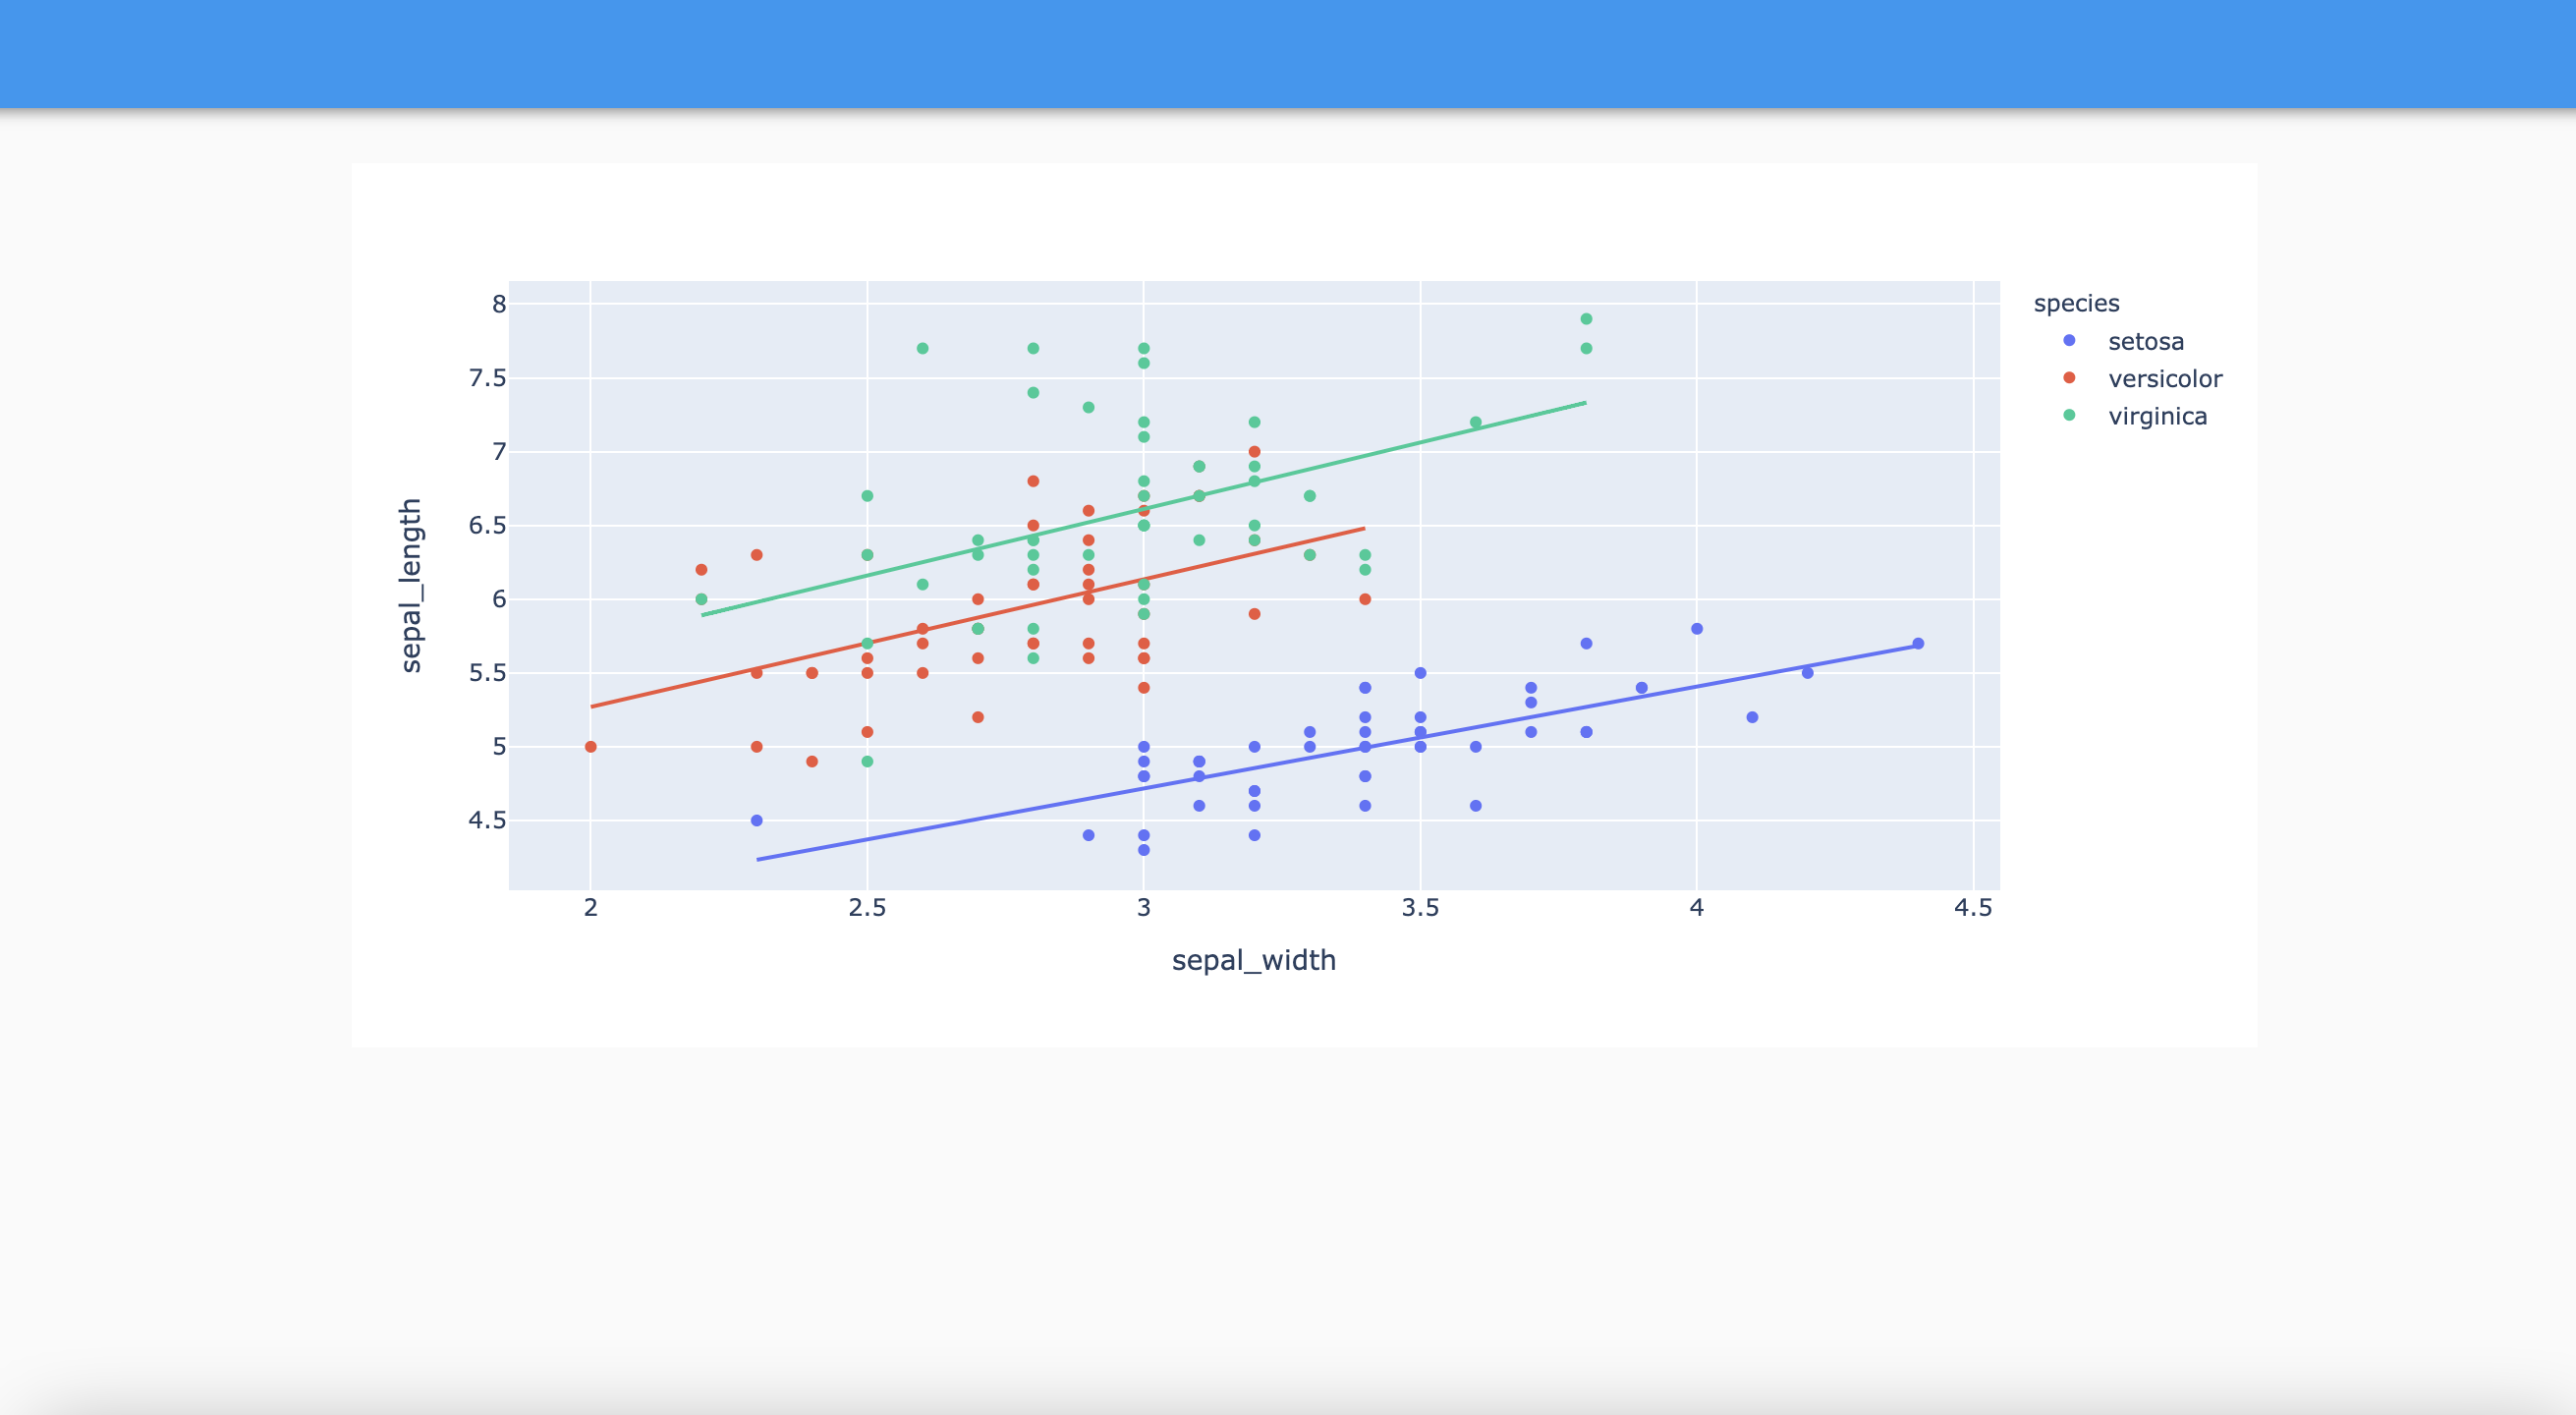
The finished figure, displayed on our app.
From this point, you could add some layout customization or continue building figures within your server function to feed into more plots.
Do you still have questions?
Our Community Forum is full of helpful information and Anvil experts.